As new technologies emerge in the clean energy sector, their ability to gain a sustained foothold depends on the decisions of many different market actors, who are greatly influenced by their access to timely, actionable information.
How do manufacturers, dealers and installers identify trends in demand or competitor activities?
How do consumers – whether individual residents or businesses – get a feel for whether they should invest in an emerging technology?
And for policymakers allocating public program dollars to help kick-start burgeoning markets, how do they evaluate and improve impacts in a timely manner?
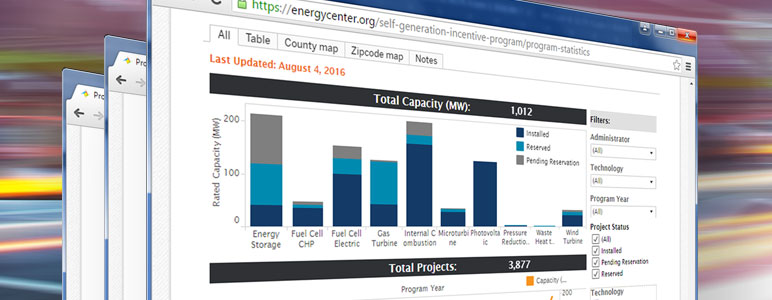
In decades past, access to key market intelligence was largely limited to those who could afford to purchase expensive data sets or those with enough patience to wait for detailed program evaluation reports to be published. Today, however, online data visualizations provide near real-time program statistics to a variety of stakeholders.
The role of online energy program dashboards in advancing market transformation is the focus of a recent analysis conducted by the Center for Sustainable Energy (CSE). We interviewed 24 users of dashboards for four energy programs in California and Massachusetts. The results were described in a white paper presented in August at a conference organized by the American Council for an Energy-Efficient Economy (ACEEE).
CSE's research shows that program dashboards bring a wide variety of benefits to several types of market actors, including those in industry, policymakers, nonprofits and research organizations.
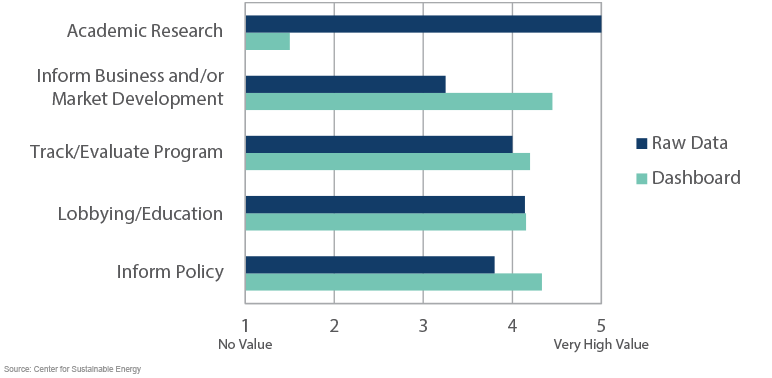
Value of Dashboards vs. Spreadsheet Data
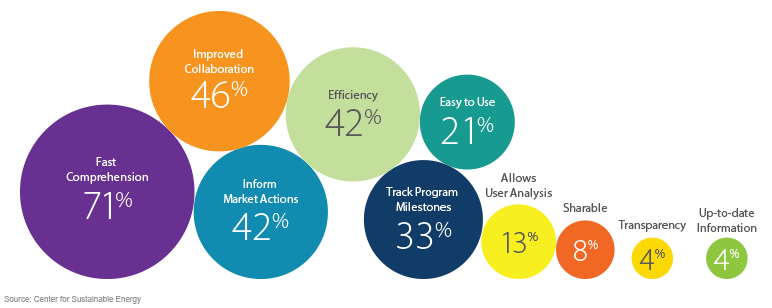
Nearly half of the interviewees said they used dashboards to understand the lay of the market and inform market development. Manufacturers, installers and car dealers monitor demand and competition by geographic region, time, technology type and other factors. They can even show the dashboards to potential customers during the sales process, to illustrate adoption rates and provide a sense of urgency for cashing in on dwindling rebate budgets.
A similar number cited the facilitation of a common understanding or improved collaboration as a benefit. Examples included stakeholders pulling up a dashboard on a tablet at a conference to hold a fact-based conversation on program and policy development, and a government official referencing a dashboard to answer a media inquiry.
Other user examples included a consultant tracking pricing trends over time, a local government analyzing technology diffusion to inform climate action planning and a nonprofit organization citing regional electric vehicle adoption information to support a grant proposal for charging infrastructure.
Importantly, this information can be absorbed with a quick glance at the dashboard, perhaps with the simple manipulation of a few filters. More than two-thirds of those interviewed cited fast comprehension as a benefit of dashboard use. Gone are the days of spending hours poring over an Excel spreadsheet to identify market trends.
Benefits of Data Visualizations
Given the many reported benefits of dashboards, it’s a natural conclusion that funding agencies and program administrators should consider building public-facing data visualization tools into their program design, budget and reporting requirements. By making timely intelligence accessible to the entire spectrum of market actors, program administrators can spur a positive feedback loop extending well beyond the confines of the program and transform a market.
Read the paper: Accelerating Market Transformation with Energy Program Data Visualizations
View the dashboards surveyed