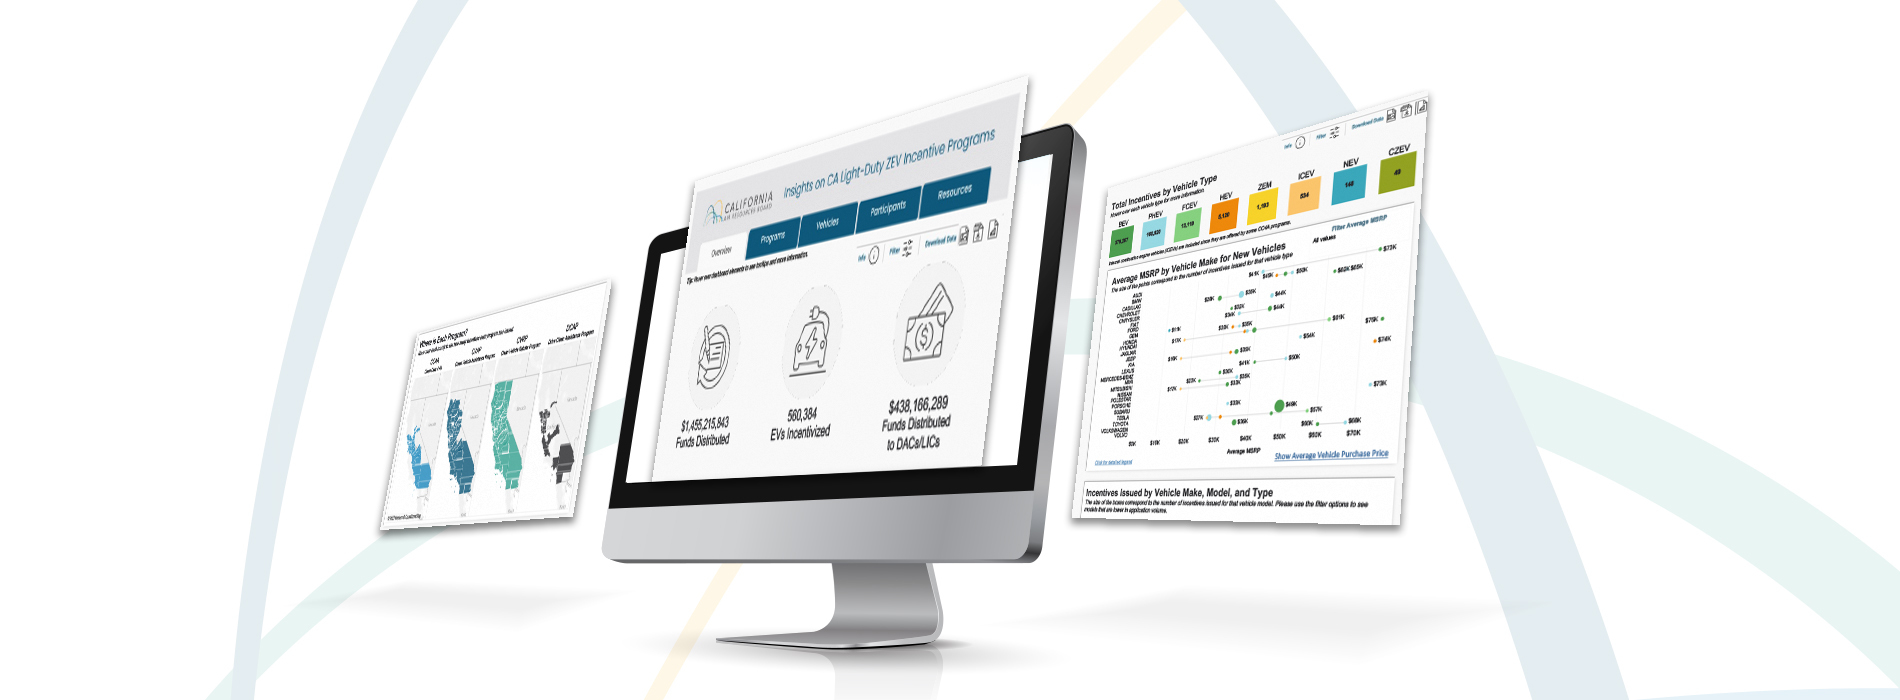
Since 2010, Californians have received nearly $1.46 billion in light-duty zero-emission vehicle (ZEV) incentives to buy or lease over 560,000 electric vehicles (EVs) through four principal incentive programs of the California Air Resources Board (CARB). Low-income communities and disadvantaged communities received $438 million in incentives through these programs — nearly one-third of the total.
A new interactive dashboard, created by the Center for Sustainable Energy (CSE) for CARB, enables policymakers, researchers and others to dig deeper into these programs’ metrics to analyze trends and surface insights that can inform future policymaking to accelerate the equitable adoption of clean cars.
The California Zero Emission Vehicle Insights (CALZI) dashboard aggregates data from four CARB-funded programs: Clean Cars 4 All (CC4A), Clean Vehicle Rebate Project (CVRP), Clean Vehicle Assistance Program (CVA Program) and Drive Clean Assistance Program (DCAP).
Using data visualization and equity best practices, this centralized dashboard makes it easier to analyze program impact based on participant and household demographics and geographical location. It can help policymakers identify gaps in program reach or make improvements to support wider EV adoption in California.
How to use the CALZI dashboard
CALZI dashboard information is organized into five tabs: Overview, Programs, Vehicles, Participants (with subtabs for demographics, households and geographies) and Resources.
CALZI allows users to:
-
Compare key quantitative and qualitative performance metrics for four CARB-funded light-duty ZEV programs.
-
Customize dynamic data visualizations with filters to dive deeper into the data.
-
Download data and visualizations for reporting and analysis.
-
Track program application growth trends over time.
-
View EV adoption by county and city to explore participation disparities and gaps and guide targeted infrastructure investments and community outreach.
-
Track the average manufacturer's suggested retail price (MSRP), make, model and type of incentivized vehicles.
Consider the context
The dashboard provides a program-specific breakdown of incentives issued, funds disbursed and type of vehicle incentivized. Definitions of acronyms and other context can be seen by hovering over the text of the data point or found in the Notes section at the bottom of each tab and the Resources tab.
The dashboard does not include programs for medium- or heavy-duty zero-emission vehicles or programs to incentivize EV charging infrastructure. For statewide EV sales statistics go to the California Energy Commission dashboard and for national EV sales statistics go to the Alliance for Automotive Innovation.
When interpreting data from the CALZI dashboard, it's important to consider contextual factors:
-
Correlation vs. causation: The CALZI dashboard might show correlations, such as a link between the distribution of funds and the number of EVs incentivized. However, it's important not to assume causation; other factors might be influencing outcomes.
-
Market dynamics: The EV market is influenced by a variety of factors, including technological advancements, battery costs, changes in consumer preferences, policy changes and broader economic conditions. These factors can significantly impact adoption of EVs and the effectiveness of incentive programs.
-
Infrastructure availability: The availability of charging infrastructure can greatly influence the adoption of EVs. Incentive programs might drive initial purchases, but without adequate charging stations, long-term usage and market growth may be hindered.
-
Geographic and socioeconomic diversity: California's diverse geography and socioeconomic landscape mean that the same level of incentives may not work equally across different regions. Urban areas may show higher adoption rates compared to rural ones due to increased infrastructure and greater awareness.
We welcome your feedback
CSE interviewed key stakeholders who use CARB’s light-duty ZEV incentive programs data and employed data visualization and equity best practices to develop the dashboard.
Whether you're an industry expert looking to identify trends or a policymaker researching EV incentives, we think you'll find the tool valuable. We encourage you to test the CALZI dashboard and share any feedback or ask questions by emailing CALZI@energycenter.org.